In this series:
- Search Refiners part 1 – Expanding the OOTB search Refinement Panel
- Search Refiners part 2 – Use of CustomFilters
- Search Refiners part 3 – Chart based (this post)
- Search Refiners part 4 – User selection based
In the previous two posts about search refiners no code was written to adjust the OOTB Search Refinement Panel, just some XML modifications.
In this post a chart based search refiner will be built and some code is needed to accomplish this. The refinement will be built on the Modified Date.
Create the refiner
To get the refinement categories and their values, the RefinementManager class will be used.
The RefinementManager will get an instance of the refinement manager on the current page. This means the OOTB Search Refinement Panel has to be present on the current page. Not only it has to be present, it also has to have the filtercategory on which the refinement is going to perform on, in this case the Modified Date.
Get the instance of the refinement manager:
RefinementManager refinementManager = RefinementManager.GetInstance(this.Page);
To get the refinement values:
XmlDocument refinementXmlDoc = refinementManager.GetRefinementXml();
The GetRefinementXML method gets the filtered xml document of the refinement manager.
For the example is this post only the Modified Date is of interest, so an XPath expression is used to get to the right filter category and values:
XmlNodeList filters = refXmlDocument.DocumentElement.SelectNodes("/FilterPanel/FilterCategory[@ManagedProperty='" + refiner + "']/Filters/Filter[Count>0]");
The refiner variable is declared as:
private const string refiner = "Write";
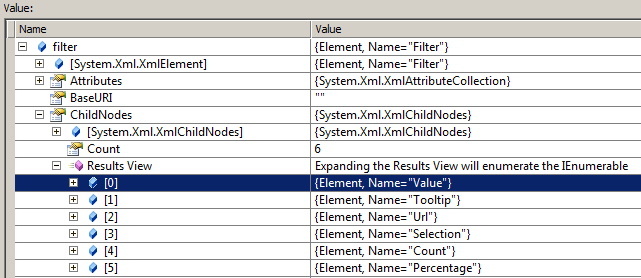
By looping through the XMLNodes in the XMLNodeList the neccesary values are available, just as in the XML which is rendered by the OOTB Search Refinement Panel. The elements of the childnodes (filter categories) are shown:
Actually, this was the most interesting part. What’s left is displaying the values to the user, in this case: putting it in a chart; and binding it all together.
Putting it all together
In CreateChildControls the chart is setup:
private Microsoft.Office.Server.WebControls.Chart chart;
protected override void CreateChildControls()
{
    ChartArea area = new ChartArea("Pie Chart");

    chart = new Microsoft.Office.Server.WebControls.Chart();
    chart.Width = 160;
    chart.Height = 160;
    chart.ChartAreas.Add(area);

    Controls.Add(chart);
}
And in the OnPreRender the refiment manager, the values of the filter category Modified Date and the chart are put together.
protected override void OnPreRender(EventArgs e)
{
    RefinementManager refManager = RefinementManager.GetInstance(this.Page);

    XmlDocument refXmlDocument = refManager.GetRefinementXml();

    if (refXmlDocument != null)
    {
        Series chartSeries = new Series();
        chartSeries.ChartType = SeriesChartType.Pie;

        XmlNodeList filters = refXmlDocument.DocumentElement.SelectNodes("/FilterPanel/FilterCategory[@ManagedProperty='" + refiner + "']/Filters/Filter[Count>0]");

        if (filters.Count != 0)
        {
            foreach (XmlNode filter in filters)
            {
                string xValue = filter.SelectSingleNode("Value").InnerText;
                string yValue = filter.SelectSingleNode("Count").InnerText;

                int i = chartSeries.Points.AddXY(xValue, yValue);

                // display text in chart
                chartSeries.Points[i].Label = xValue;

                //use the url to make the pie parts clickable
                chartSeries.Points[i].Url = filter.SelectSingleNode("Url").InnerText;
            }

            //add 'Any Modified Date' option
            XmlNodeList xmlFilterNodesAllItems = refXmlDocument.DocumentElement.SelectNodes("/FilterPanel/FilterCategory[@ManagedProperty='" + refiner + "']/Filters/Filter[Count='']");
            chart.Titles.Clear();
            System.Web.UI.DataVisualization.Charting.Title allItemsTitle = new System.Web.UI.DataVisualization.Charting.Title();
            allItemsTitle.Text = xmlFilterNodesAllItems[0].SelectSingleNode("Value").InnerText;
            allItemsTitle.Url = xmlFilterNodesAllItems[0].SelectSingleNode("Url").InnerText;
            allItemsTitle.ToolTip = "Refine by: " + allItemsTitle.Text;
            allItemsTitle.ForeColor = Color.FromArgb(0, 114, 188);
            chart.Titles.Add(allItemsTitle);
        }

        if (chartSeries.Points.Count > 0)
            chart.Series.Add(chartSeries);
    }
}
In the XPath expressions used to get the filter values for Modified Date and ‘Any Modified Date’ are slightly different. Look at the Count differences.
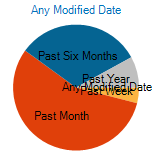
By removing the Count in the first XPath expression the chart will display ‘Any Modified Date’ and the chart kind of gets messed up:

and ‘Any Modified Date’ is not clickable, because it get’s no colored part in the pie chart. The reason for this is that the Count value for Any Modified Date is empty.
This is the reason to use Count>0 for the values displayed in the pie chart and Count=” to get Any Modified Date.
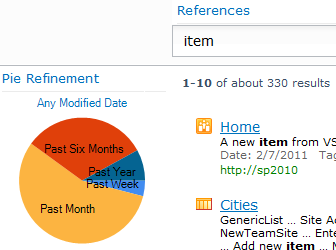
The pie chart now looks like this:

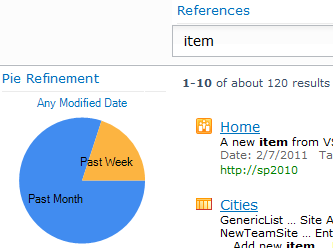
And after selecting ‘Past Month’:
Summary
To transform a textual search refiner to a chart based search refiner is shown in this post.
As long as the OOTB Search Refinement Panel is present on the page and the filter category used by the code is present in the Filter Category Definition (property of Search Refinement Panel web part), the code in this post can be used to visualize a search refiner.
If it’s not present, you can extend the Refinement Panel webpart. This is not covered in this post, but maybe I’ll show you this in a future post.


Pingback: Search Refiners (part 2) – Use of CustomFilters
Pingback: Search Refiners (part 1) – Expanding the OOTB search Refinement Panel
Hello,
Great article! I just have one question: the Microsoft.Office.Server.WebControls.Chart class doesn’t seem to exist in my copy of the Microsoft.Office.Server.dll. I am using SharePoint 2010. I can’t seem to find the resource to use in my solution. Where could I find it?
Regards
RoelBSS
Hi Roel,
You have to reference the Microsoft.Office.Server.Chart assembly.
Regards, Anita
Hi Anita,
Weird, I have a reference to the Microsoft.Office.Server.dll in my solution, but it doesn’t seem to contain the .Chart namespace. I’ve imported the assembly from my /program files/…/14/ISAPI/ folder.. any idea what is wrong here? Do I need another version of the assembly?
regards,
Roel
Hi Roel,
Microsoft.Office.Server.Chart is a separate assembly. Please check the GAC.
Regards, Anita
Hello,
Thank you for this nice article!
I have created a visual web part with this above code. Build and deployed it in a SharePoint web application and it is successful.
As you have mentioned I have added the following definition in Filter Definition
I arrived at the results with Modified date in the Refinement panel but I am unable to see the Visual refiners (Charts) in the Refinement Panel.
Please let me know where I am missing?
Thanks in advance!
Hi, interesting article but did you happen to have tried this in SP 2013? I am stuck for weeks on the problem that in 2013 refinementManager.getRefinementXml() always return null…
I checked the ULS logs, even reinstalled my search service but nothing helps.
So as my last resort, i post a comment, hoping for a reply 😉
Hello, when i try to get the RefinementManager in SP 2013, it is never initialized thus i can not call the getRefinementXML() without it being null. Do you have any ideas why the refinementmanager is never initialized? THank you!
Hi Geert, Verth,
I didn’t try this in SP 2013, but back in 2011 I was using SP2010.
Regards, Anita