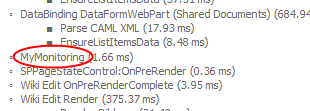
The Developer Dashboard is great to see what’s going on when loading a page in SharePoint 2010.
Windows PowerShell is THE application to enable/disable the Developer Dashboard in SharePoint 2010. Here are the commands:
$service=[Microsoft.SharePoint.Administration.SPWebService]::ContentService.DeveloperDashBoardSettings;
$service.DisplayLevel = “On”;
$service.Update();
The displaylevel can be On, Off or OnDemand. When set to OnDemand an icon is added to the top right corner to toggle the On/Off state of the Developer Dashboard (enlarged):

The DisplayLevel is an enumerator used to specify behavior aspects of the Developer Dashboard, check also MSDN:
| Member | Description |
| Off | Enumeration value = 0: Dashboard feature is disabled |
| OnDemand | Enumeration value = 1: Dashboard feature is available on request |
| On | Enumeration value = 2: Dashboard feature is enabled |
When you receive the following error:
Unable to find type [Microsoft.SharePoint.Administration.SPWebService]: make sure that the assembly containing this type is loaded.
Two solutions:
- You are running Windows PowerShell in stead of SharePoint 2010 Management Shell:
use SharePoint 2010 Management Shell. - You are running Windows PowerShell in stead of SharePoint 2010 Management Shell:
make Windows PowerShell behave like the SharePoint 2010 Management Shell by running ‘add-pssnapin microsoft.sharepoint.powershell’ in Windows PowerShell.
Want to include some of your own code in the monitoring of the dashboard?
Just wrap it up in a new SPMonitoredScope:
using (SPMonitoredScope scope = new SPMonitoredScope(“MyMonitoring”))
{
//your code to monitor here
}


Pingback: Set Developer Dashboard level by Visual Studio